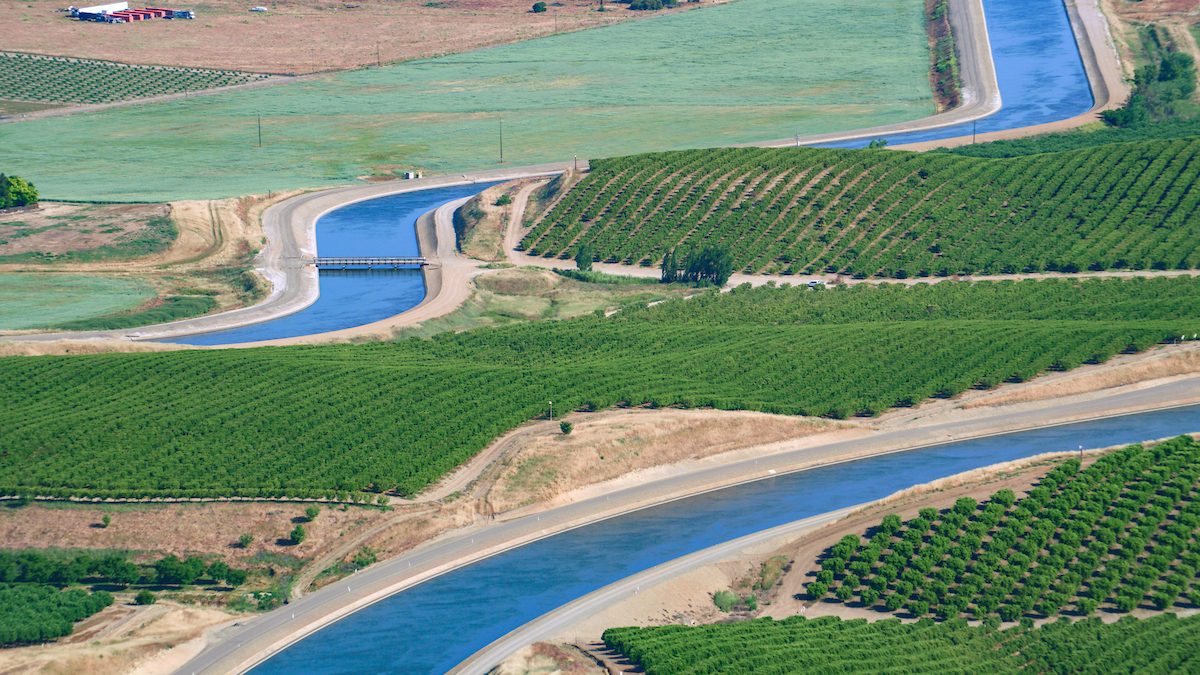
There is no single place to look up what a California water or irrigation district charges for water. The numbers live in scattered rate sheets, board minutes, Agricultural Water Management Plans, Proposition 218 notices, and county service reviews. We pulled them into one structured dataset covering hundreds of agencies, with a live source behind every figure. The picture is stark, and it shapes how the state uses its most contested resource.
The headline is simple. Farms in California pay a tiny fraction of what households pay for the same acre-foot of water. And across much of the state, agricultural water is cheap enough that there is little financial reason to invest in using it more efficiently.
On average, California farms use about 40 percent of the state’s water — or about 80 percent of all the water used by homes and businesses.1 The 40 percent figure counts California’s total water use, which includes the environmental flows kept in rivers and wetlands; measured against developed water alone — the supply actually diverted and managed for human use — agriculture is closer to 80 percent.15 Either way, how that water is priced carries outsized consequences for the state’s most contested resource.
Farms pay roughly 18 times less than households
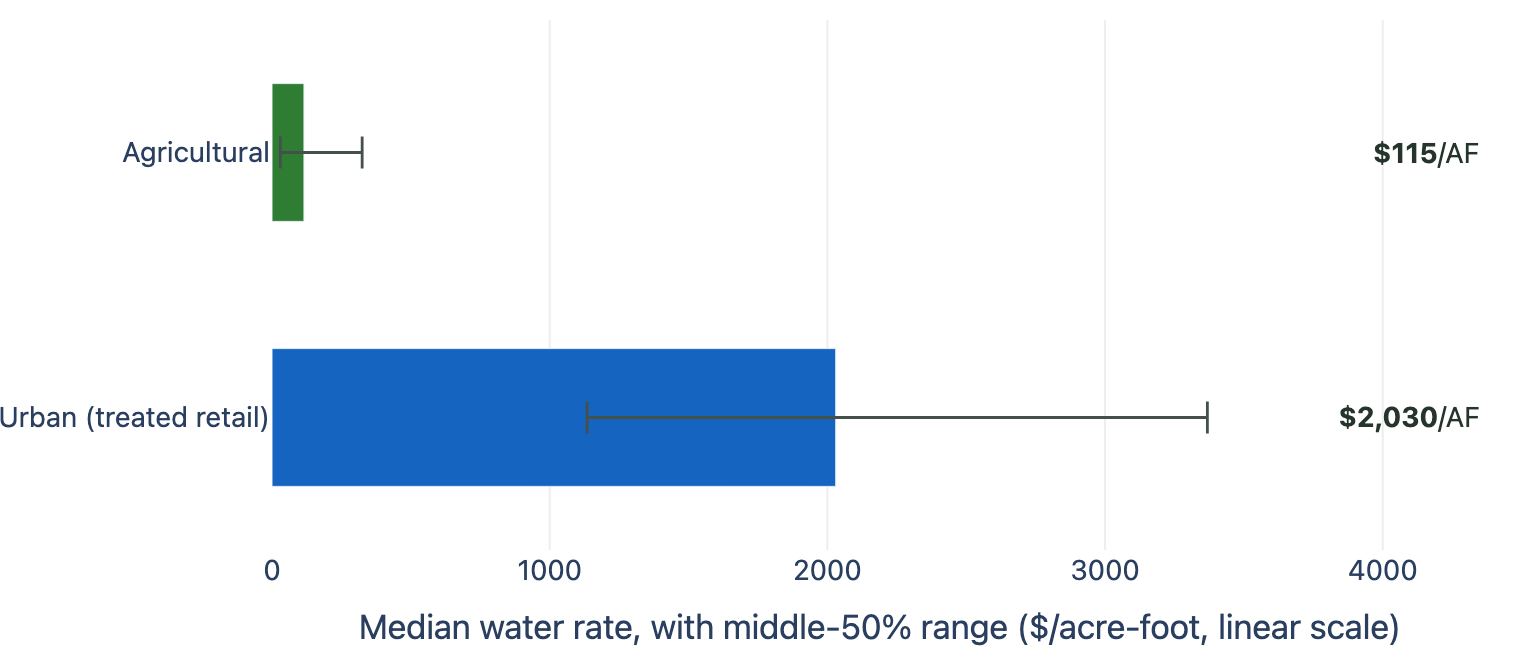
Across the agencies in our dataset, the median agricultural water rate is about $115 per acre-foot (a median across a growing convenience sample of a few hundred agencies, not a random survey — see the data note below). The median urban (treated retail) rate is about $2,030 per acre-foot. But that retail figure is mostly the cost of treating water and piping it to a tap, not a price on the water itself — so the cleaner, apples-to-apples comparison is for raw, untreated supply. A 2025 analysis from UCLA’s Institute of the Environment and Sustainability reached the same conclusion from the opposite direction: California cities pay roughly 20 times what farm districts pay for raw water — about $722 versus $36 per acre-foot — and several large irrigation districts pay nothing at all.2 On a normal linear scale, the difference is hard to overstate: the agricultural bar barely registers next to the urban one.
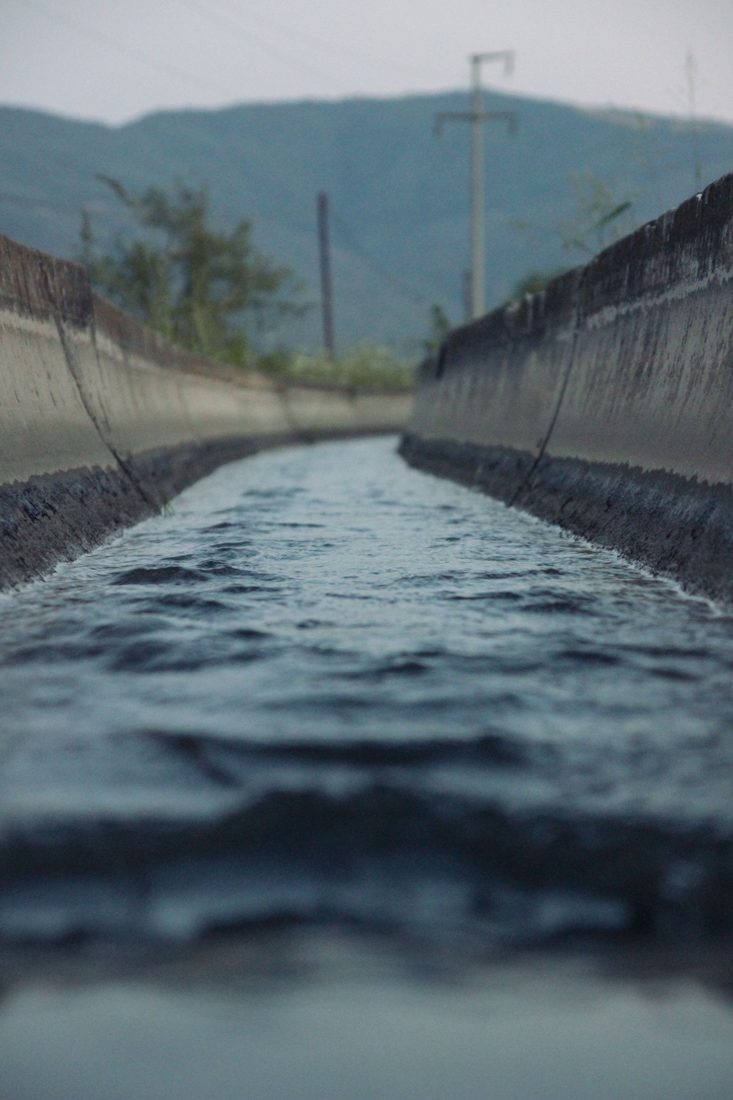
Some of this gap is expected. Agricultural water is usually raw and untreated, moved by gravity through canals, while household water is treated to drinking standards, pressurized, and piped to the tap. So a pure per-acre-foot comparison is not a like-for-like comparison of the underlying resource. But it is a fair comparison of the price signal each user faces. A farmer weighing a drip system and a homeowner weighing whether to replace a lawn are each responding to the rate on their own bill, and those bills are an order of magnitude apart.
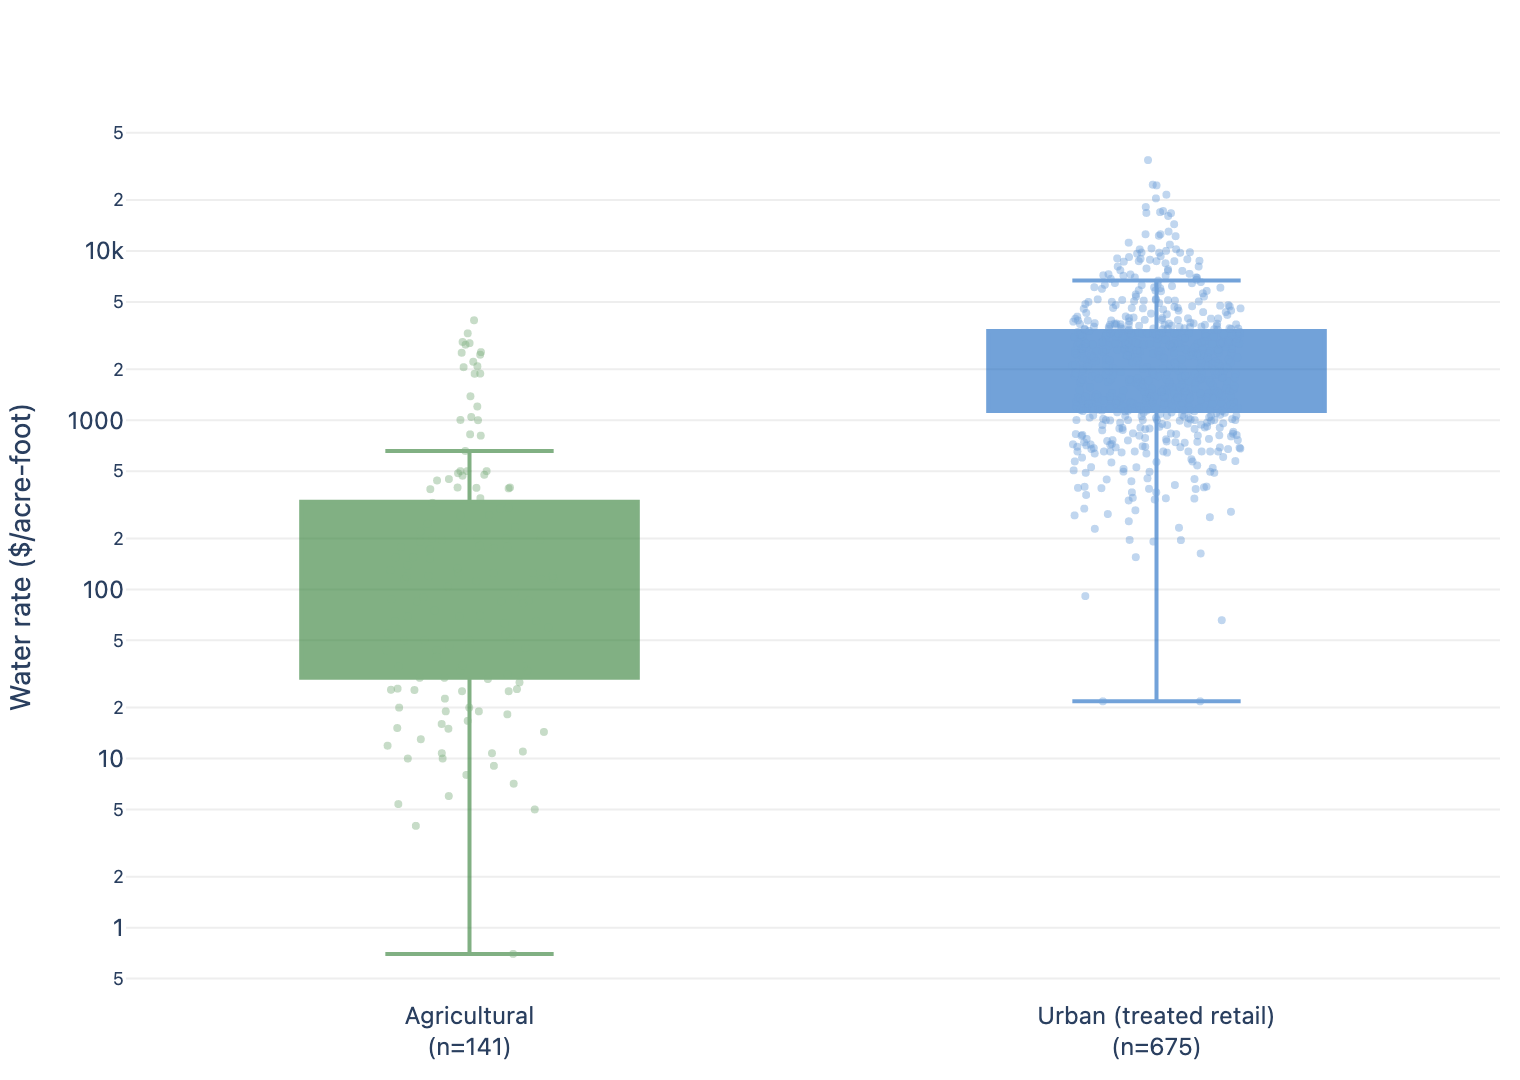
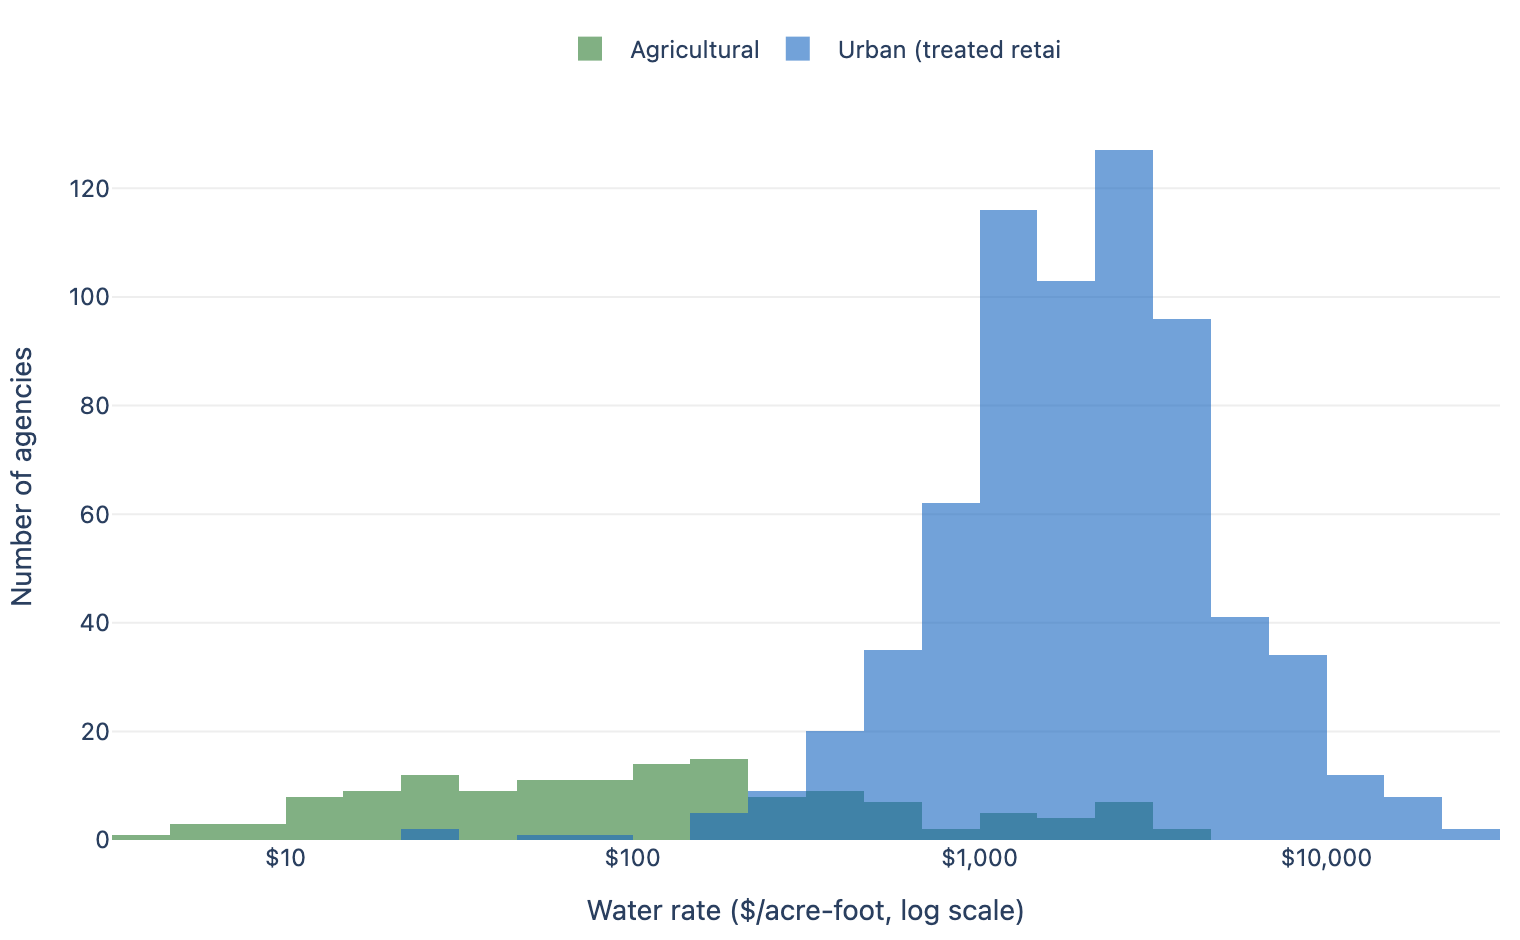
The pattern is not just about the median. Looking at the full spread of every agency, agricultural rates sit far below urban (treated retail) rates, which run an order of magnitude higher. (The chart below shows every agency; use the Log scale / Linear toggle above it. Log makes the cheapest and most expensive water both legible; the capped linear view restores the true size of the gap. Each point is one agency.)
How cheap is "cheap"?
For a large share of California agriculture, water is close to free relative to the other costs of farming. About 34 percent of agricultural districts charge under $50 per acre-foot, and roughly 18 percent charge under $25. A number of Sacramento Valley and senior water right districts deliver water for single-digit dollars per acre-foot. Much of this water comes from federal projects priced well below the cost of delivering it: districts such as Westlands pay under $40 per acre-foot for Central Valley Project supply, and several Colorado River districts pay the federal government nothing for the water itself.2,3
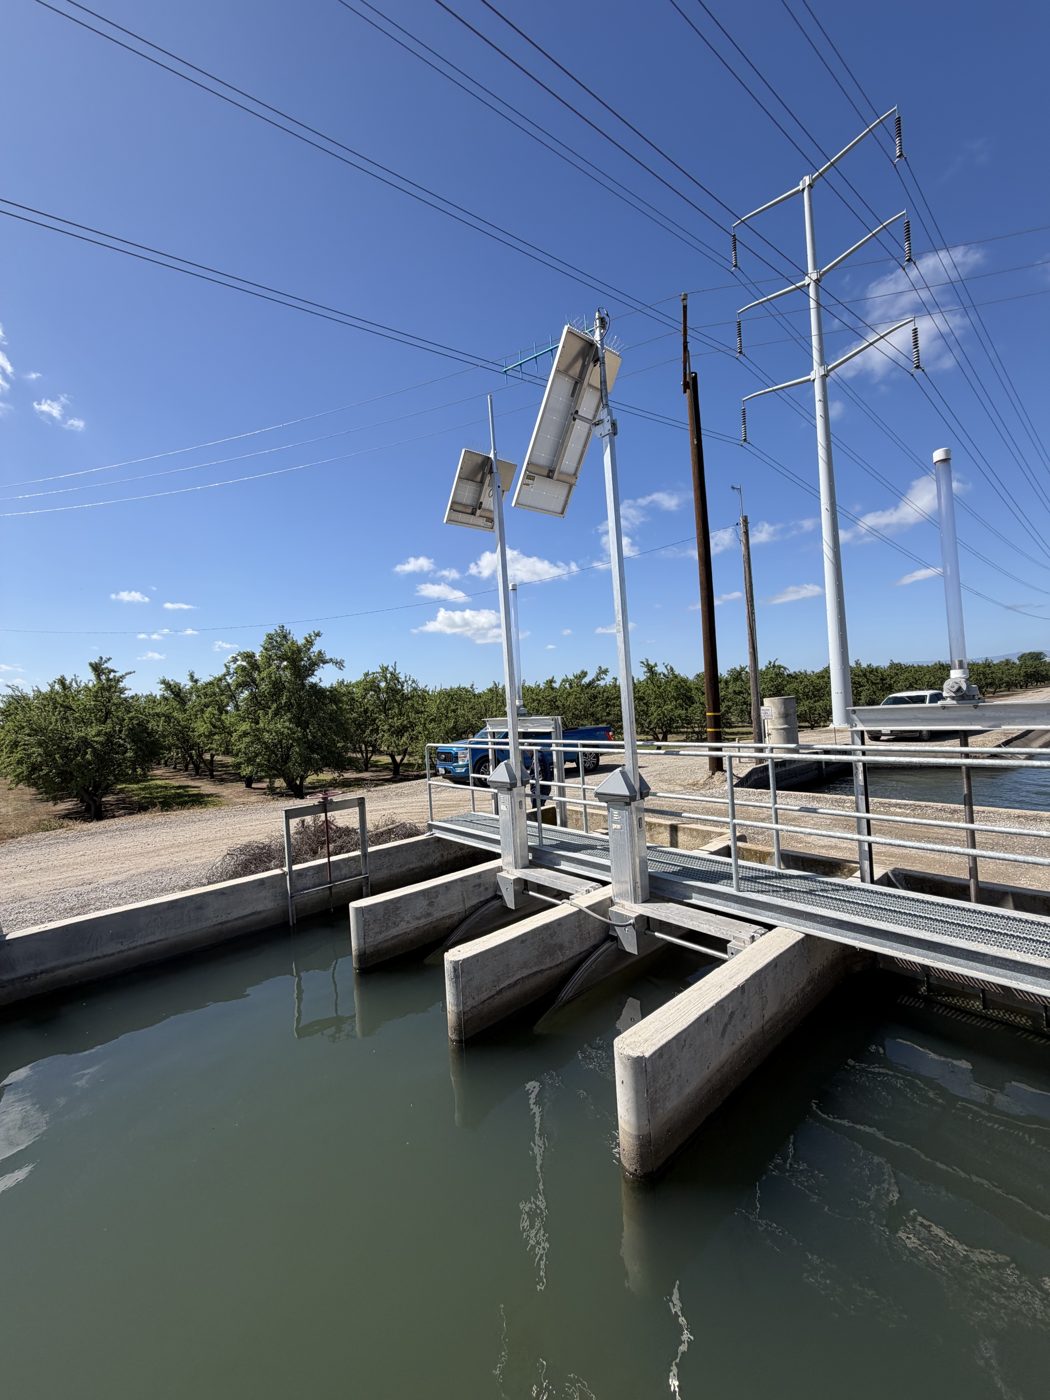
This is the core of the modernization problem. Drip systems, canal lining, soil moisture sensors, automated gates, and tailwater recovery all cost real money, and they pay for themselves by saving water. But if water costs $20 to $115 an acre-foot, the dollar value of the water saved is small and the payback stretches out for years. Empirical work bears this out: agricultural water demand is relatively inelastic. California estimates put the price elasticity at roughly −0.1 to −0.3 — meaning a 10 percent increase in the price of water reduces the amount used by only about 1 to 3 percent — so farmers trim use only modestly as rates rise.4 Efficient irrigation has nonetheless spread substantially: drip and micro-irrigation had reached roughly half of California’s irrigated acres by 2010, the most recent comprehensive survey, up from about 16 percent in 1991 — a near-tripling — though these figures exclude flood-irrigated rice. That shift was driven more by yield, crop quality, and outright scarcity than by the posted price of water; the argument is not that modernization stalled but that the remaining efficiency gains are where a stronger price signal would matter most.5 Efficiency also does not automatically leave more water in rivers or aquifers: much of the water ‘saved’ by switching to drip and micro-irrigation has gone into expanded plantings or higher-value, higher-water perennial crops rather than back into the system — a well-documented ‘efficiency paradox’ in which more efficient irrigation can leave basin-scale water use flat or even higher.16,17 Price is the signal that tells a business a resource is scarce and worth conserving. When the price is near zero, the signal is near silent.
Where water is cheap, and where it is not
The cheapness is not uniform, and the map matters. Hover any district to see its rate and source.
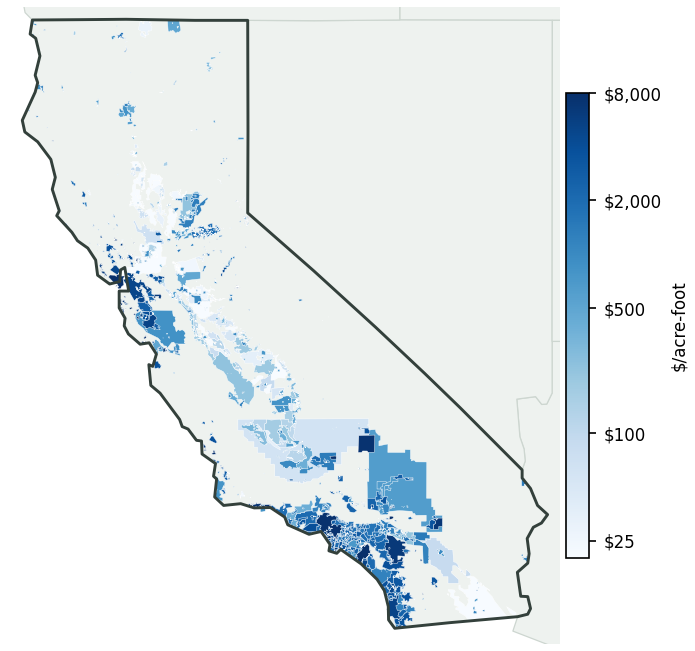
The cheapest water concentrates in the Sacramento Valley and parts of the northern San Joaquin Valley, where districts hold senior surface water rights and gravity-fed supply from rivers and federal projects, with rates from single digits to about $25 per acre-foot. The most expensive water appears in the Tulare Lake Basin and the southern and coastal regions, where supply is scarcer and more of it is pumped or imported. In import-dependent Southern California and coastal districts, rates climb past a thousand dollars per acre-foot, though many of those districts blend agricultural and urban service, so their high rates reflect the cost of imported supply more than a deliberate farm-water policy. The State Water Project carries some of the most expensive water in the West: its most distant customer, the San Gorgonio Pass Water Agency in Riverside County, pays about $2,870 per acre-foot at wholesale, largely to cover hundreds of miles of aqueduct and the energy to lift water over mountains; end customers pay far less, since much of the project’s construction cost was funded by local property taxes.2
So the low-cost picture is real, but specific. It holds for the senior-right, surface-water districts that account for much of the state's irrigated acreage, and in the broad comparison between farms and cities. It does not hold for every district. Where water is genuinely scarce, the price already reflects it, and those districts are often the ones investing most in efficiency.
The counterargument, fairly stated
Defenders of low agricultural rates make a reasonable case. Much cheap farm water is cheap because it genuinely costs little to deliver: it flows downhill from a senior right established a century ago, through infrastructure that is long paid off. Proposition 218 limits charging more than the cost of service.7 Low water costs help keep food affordable. And price is not the only signal: the Sustainable Groundwater Management Act is now forcing groundwater-dependent districts to ration and to levy pumping fees, raising the effective cost of water in exactly the over-drafted areas where conservation matters most, without changing the posted rate.8
All of that is true. But none of it changes the basic finding. For a large part of California agriculture, the marginal price of water is low enough that efficiency investments are hard to justify on water savings alone, and that is a structural reason modernization has been slow.
A management problem as much as a scarcity one
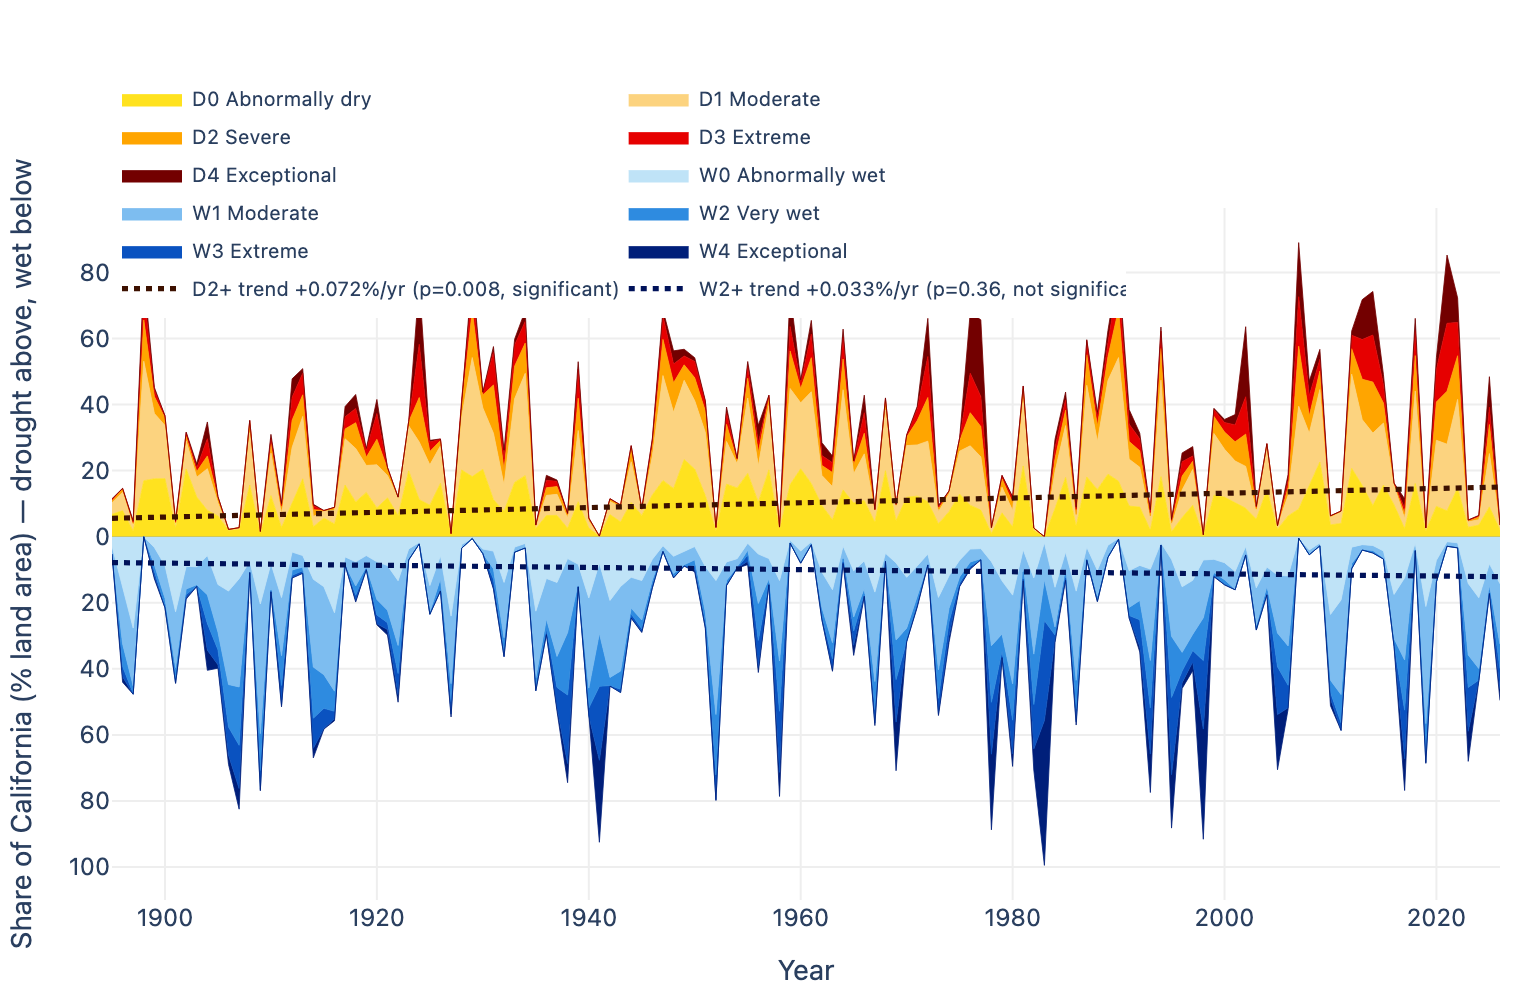
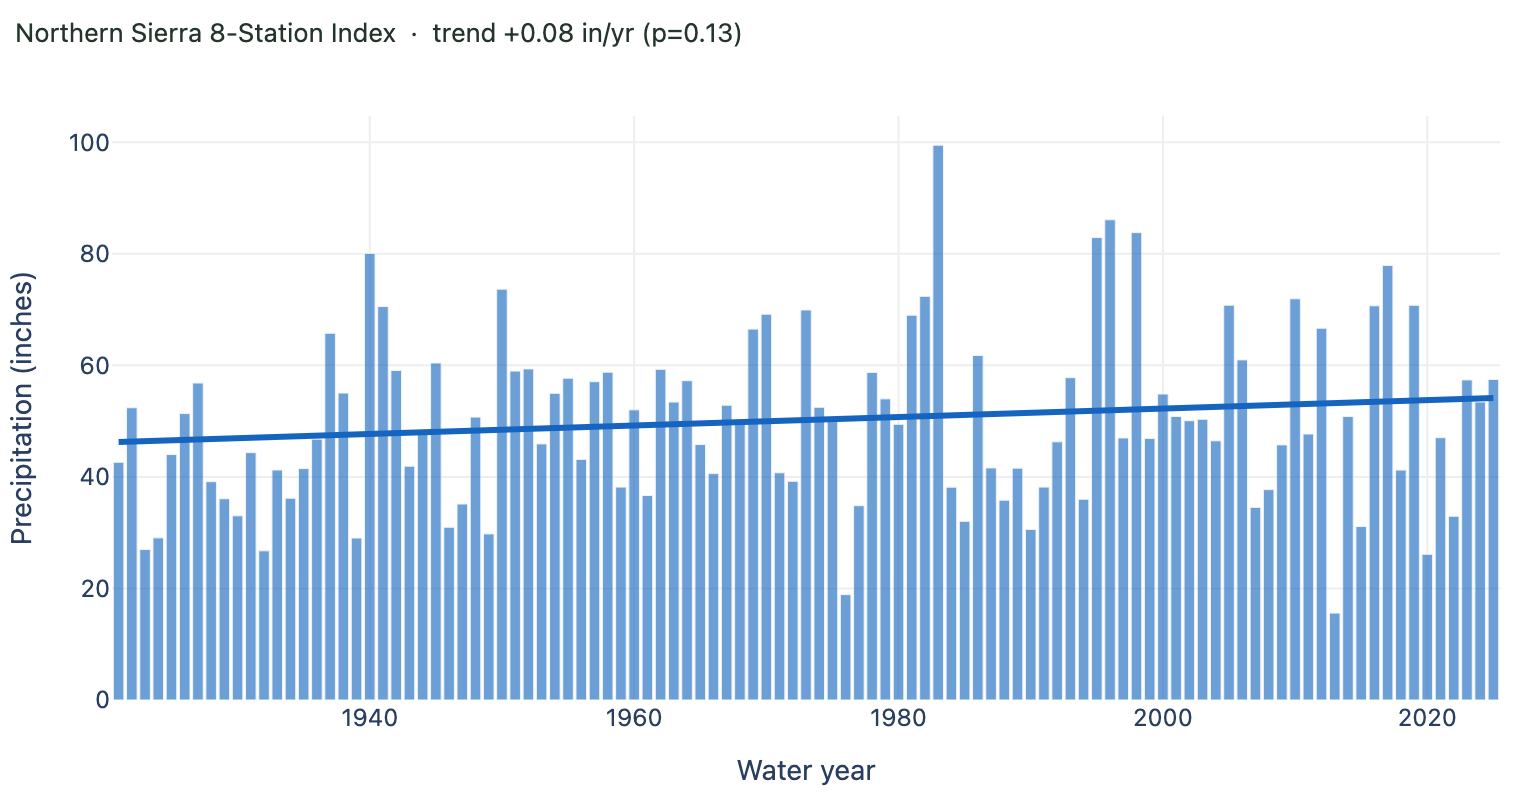
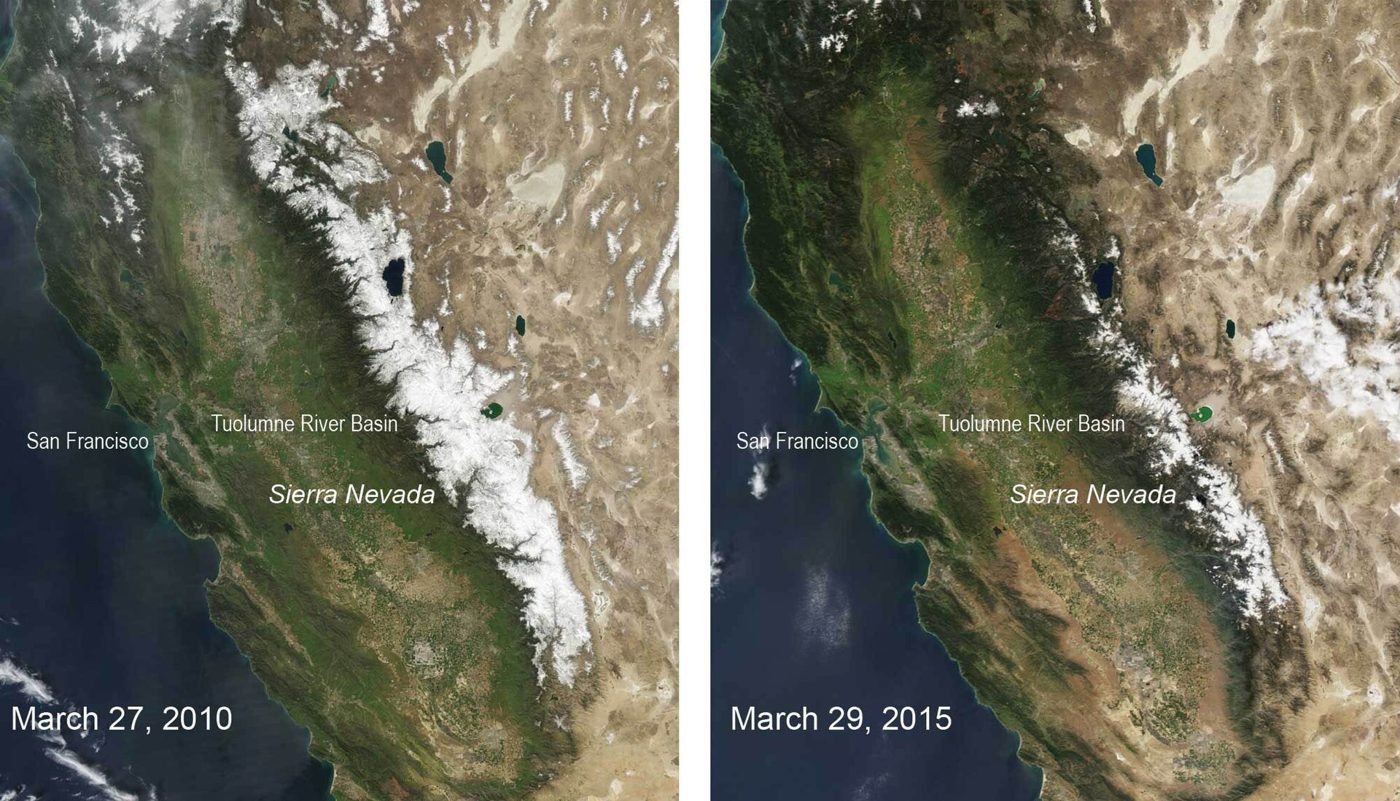
California’s water troubles are almost always pinned on drought. But the long record complicates that story. Across more than a century of data, the state’s total precipitation shows no statistically significant trend, even as the dry extremes have measurably worsened: droughts now deepen far faster than wet periods recover, an asymmetric intensification rather than a simple decline in rain and snow.13 A warming atmosphere is also swinging California more violently between wet and dry — a “precipitation whiplash” that is increasing even as average precipitation holds roughly steady.10
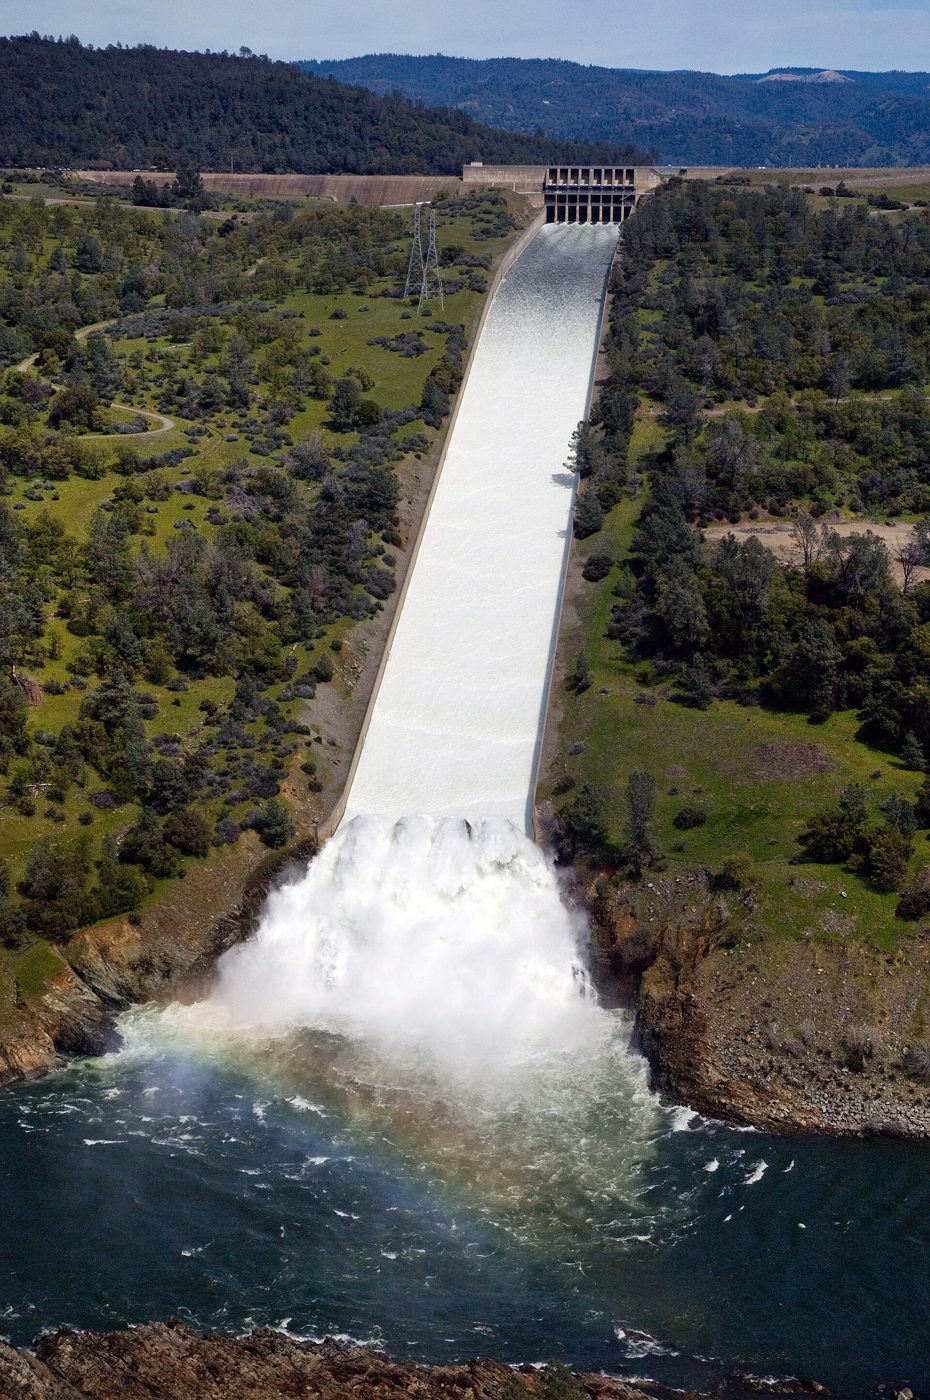
The deeper problem is where the water goes once it falls. California’s storage system was built around snow. The Sierra Nevada snowpack works as a giant frozen reservoir, holding roughly a third of the state’s water supply and releasing it slowly through spring and summer, exactly when demand peaks.11 As the climate warms, more precipitation falls as rain instead of snow, the snowpack shrinks, and what does accumulate melts earlier and faster.12 Water the system was designed to release over months now arrives in bursts that reservoirs cannot fully catch. The supply is not so much vanishing as becoming harder to hold.
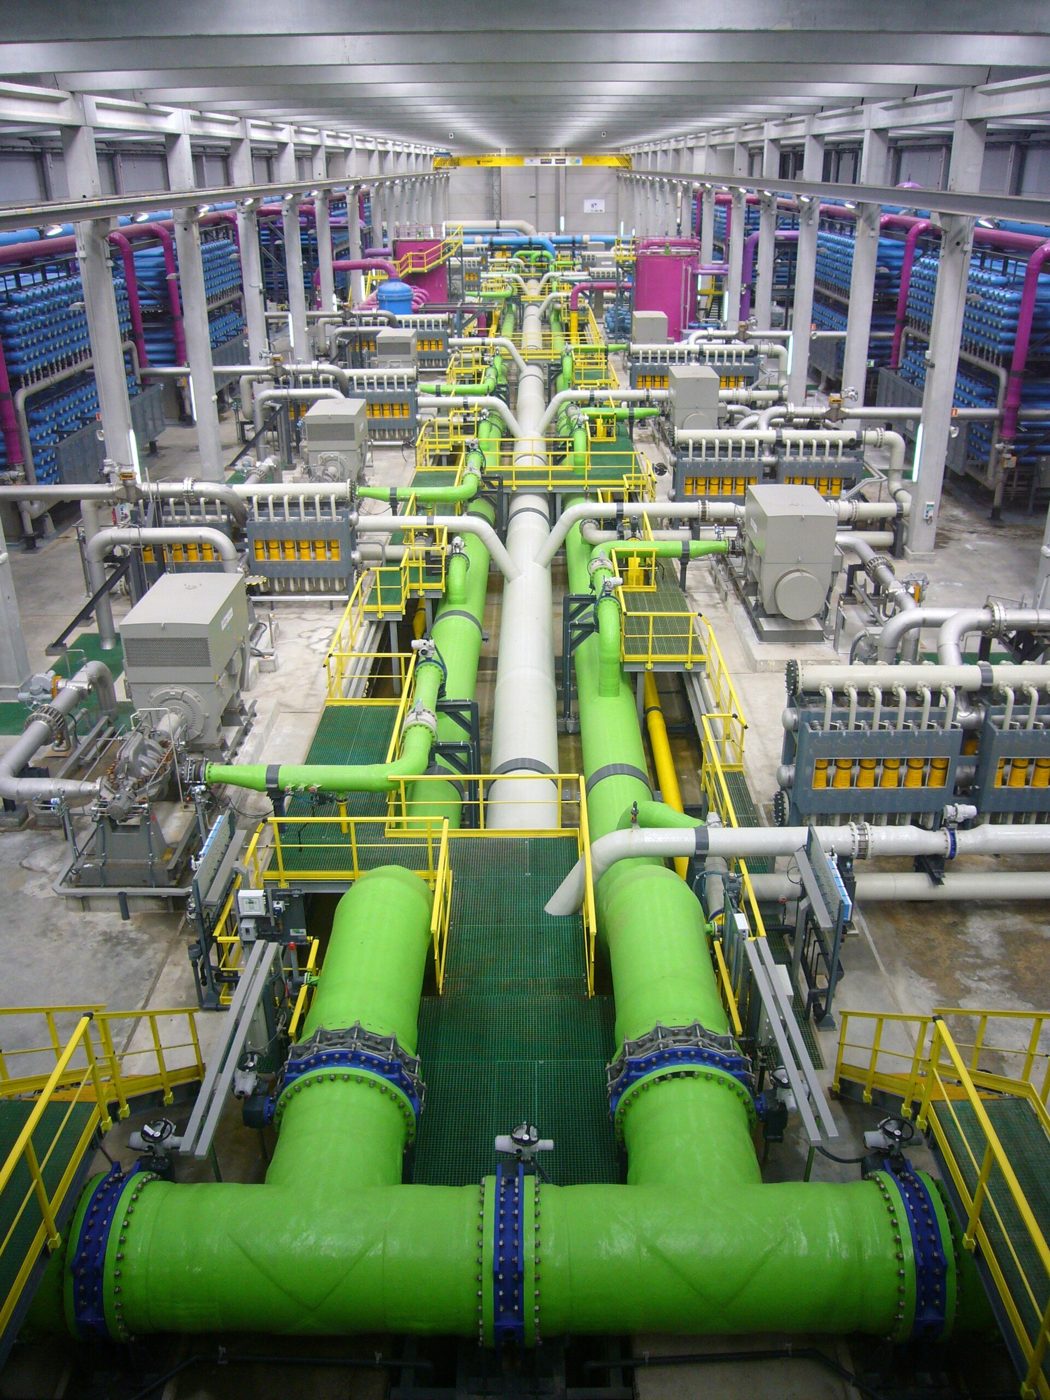
That is a management challenge, and it is a solvable one: more surface and groundwater storage, recharge, conveyance, and flexible operations all help. But there is little pressure to build any of it, and the reason traces back to price. Agriculture takes roughly 80 percent of the water California’s homes and businesses use,1 and for most of those users water is close to free.2 That pricing is not a simple lever the state can pull, either: senior water rights, long-term federal Central Valley Project and Colorado River contracts, and Proposition 218’s cost-of-service limits mean no single actor is free to reprice much of this water without changing water-rights law or renegotiating federal contracts.7 Still, the effect is the same. When the dominant use of a scarce resource carries almost no price, little pushes farmers to use less or invest in saving it — and the larger systems for storing, moving, and augmenting supply — new reservoirs, groundwater recharge, conveyance, and new supply like desalination and water recycling — stall on cost-allocation, permitting, and financing as much as on any farm-gate price. Scarcity that never reaches a bill does not change behavior.
History shows what tends to happen in the absence of a price signal: little, until a crisis forces it. In 2018, Cape Town came within months of “Day Zero,” the date the city would shut off the taps, with reservoirs near a quarter of capacity; only emergency rationing that cut the city’s water use by roughly half kept the water flowing.14 It took the imminent prospect of a major city running dry to produce conservation that pricing and planning never had — though the analogy is imperfect: Cape Town was an acute urban supply shock, not the chronic agricultural-allocation question California faces, and it was the return of winter rains, not rationing alone, that ultimately ended the crisis. A closer-to-home version is unfolding right now in Corpus Christi, Texas, where a five-year drought has pulled the city’s two main reservoirs below 8 percent of their combined capacity — the lowest on record — and residents face Stage 3 restrictions that ban lawn watering. Yet the refineries and petrochemical plants that consume an estimated 50 to 60 percent of the city’s water were not first asked to cut back, and the city kept approving water-hungry industry through the 2010s while developing no new supply after 2016; a proposed seawater desalination plant has since ballooned from about $160 million to $1.2 billion and is unlikely to open before 2028, a solution measured in years for a crisis measured in months.18 It is an American preview of the same pattern California faces: the dominant water user feels the least pressure to conserve, and planning lags until scarcity becomes an emergency. California is betting, implicitly, on a version of the same trigger — that only a catastrophe will force the changes cheap water removes any reason to make sooner.
There is another way to get there. Water priced to reflect its real scarcity and the cost of delivering it reliably would do continuously, and far less painfully, what a Day Zero does all at once: reward storage, efficiency, and reuse, and steer water toward its highest-value uses.2 California’s problem is not fundamentally that the rain has stopped. It is that the state has built an elaborate system to move and store water while the water itself stays priced at close to zero — and it is hard to manage well what costs almost nothing.
Nothing in this publication is intended to single out, criticize, or characterize any particular district, agency, company, industry, or individual. The rates and figures are presented only to illustrate broad, system-wide patterns in how water is priced across California, and any individual number should be confirmed with the relevant agency before it is relied upon.
Although great care has been taken to maintain the accuracy of the information collected and presented, Klimate Consulting does not make any express or implied warranty concerning such information and does not assume any responsibility for consequences that may arise from the use of the material. Any estimates in this publication reflect our current analyses and expectations based on available data and information. Any reference to a specific commercial product, process, or service by trade name, trademark, manufacturer, or otherwise does not constitute or imply an endorsement, recommendation, or favoring by Klimate Consulting.
References
- Peterson, C., Escriva-Bou, A., Medellín-Azuara, J., & Cole, S. (2023). Water Use in California’s Agriculture. Public Policy Institute of California. www.ppic.org
- Becker, Rachel, & Uzcátegui-Liggett, Natasha (2025, Dec 11). California cities pay a lot for water; some agricultural districts get it for free. CalMatters — reporting a study led by UCLA’s Institute of the Environment & Sustainability. calmatters.org
- Environmental Working Group. California Water Subsidies: The Central Valley Project. www.ewg.org
- Using Price Elasticities of Water Demand to Inform Policy. Annual Review of Resource Economics (2021). www.annualreviews.org
- Tindula, G. N., Orang, M. N., & Snyder, R. L. (2013). Survey of Irrigation Methods in California in 2010. Journal of Irrigation & Drainage Engineering — drip/micro-irrigation reached ~half of irrigated acres by 2010 (excluding rice); see also USDA NASS Irrigation & Water Management Survey (2018; 2023, released 2024). www.nass.usda.gov
- California Department of Water Resources. The Economy of the State Water Project (2023). water.ca.gov
- Legislative Analyst’s Office. Understanding Proposition 218. lao.ca.gov
- California State Water Resources Control Board. What is SGMA? (Sustainable Groundwater Management Act, 2014). www.waterboards.ca.gov
- UC Merced (2025). Understanding Water Rates (Central Valley district rate compilation). wsm.ucmerced.edu
- Swain, D. L., Langenbrunner, B., Neelin, J. D., & Hall, A. (2018). Increasing precipitation volatility in twenty-first-century California. Nature Climate Change. www.nature.com
- California Department of Water Resources. Snow Surveys & the Sierra Nevada snowpack (the snowpack supplies roughly a third of California’s water). water.ca.gov
- Future implications of enhanced hydroclimate variability and reduced snowpack on California’s water resources. Environmental Research: Climate (2024). iopscience.iop.org
- Klimate Consulting. California Water Intelligence — drought asymmetry & precipitation-trend analysis (NOAA NCEI SPI, CDEC, CA DWR). data.klimateconsulting.com
- National Geographic. How Cape Town Avoided Day Zero, and What We Can Learn. education.nationalgeographic.org
- California Department of Water Resources. Agricultural Water Use Efficiency — agriculture is ~40% of the state’s total water use (incl. environmental and urban) or ~80% of all developed water. water.ca.gov
- Grafton, R. Q., et al. (2018). The paradox of irrigation efficiency. Science, 361(6404), 748–750 — efficiency gains are frequently reinvested in expanded or intensified production rather than returned to the basin (the rebound / Jevons effect). www.science.org
- Public Policy Institute of California. Agricultural Land Use in California — documents the shift to perennial crops and the resulting hardening of agricultural water demand. www.ppic.org
- Texas Tribune and Grist (2026). Corpus Christi water crisis — a five-year drought left the city’s reservoirs near record lows; oil, gas, and petrochemical facilities account for ~50–60% of municipal water use, and a proposed seawater desalination plant stalled amid ballooning costs. www.texastribune.org